Boab Metals
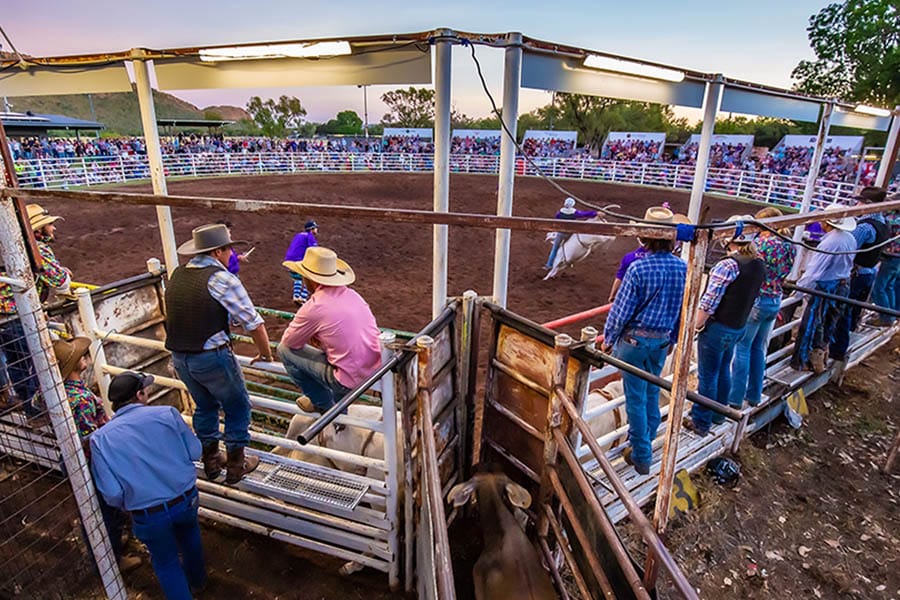
Ord Valley Muster
The Boab Metals Limited Ord Valley Muster is an annual festival of music, art and culture that brings together the vibrant East Kimberley community. It attracts thousands of visitors to Kununurra to experience the stunning landscape, cultural diversity and famous Kimberley hospitality.
Boab Metals is the naming rights sponsor of the Ord Valley Muster for 2023.
Boab’s sponsorship of the iconic event underlines the Company’s commitment to the town of Kununurra and the broader Kimberley
community.
For more information see: www.ordvalleymuster.com.au


- Geology
- ENVIRONMENTAL
APPROVALS - BOAB EXPLORATION &
RESOURCE DELINEATION - DRILLING
HIGHLIGHTS - MAJOR
MILESTONES - RESOURCES AND
RESERVES - 2023 Definitive
Feasibility Study - METALLURGICAL
TESTWORK
Regional Geology (Geological Setting)
The onshore Bonaparte Basin is a remote and under-explored mineral province prospective for carbonate-hosted Zn-Pb (Ag) mineralisation.
The Late Palaeozoic rocks (Devonian to Carboniferous, 380 to 320 Ma) of the Bonaparte Basin were deposited on the margin of a rift basin bounded by Precambrian basement. Map 1 below shows the onshore triangular shape of the basin and its opening and deepening to the north. In the south and east, fault reactivation extending from the Halls Creek Orogen controlled its intra-basin geometry.
The Precambrian Pincombe Inlier was an emergent palaeo-high during Late Devonian to Early Carboniferous sedimentation and separates the Burt Range Sub-basin in the east from the Carlton Sub-basin in the west. The early sediment horizons of the Burt Range Sub-basin are referred to as the Cockatoo, Ningbang and Burt Range Formations, which are made up of basal clastic rocks (sandstones) and dolomitized limestone and clastic units, representing a continuation of continental to marine deposition. Within the project area the succession measures a total thickness of about 300 m .
The Bonaparte Basin sediments are the time equivalents to the Lennard Shelf sediments which host the Mississippi Valley-type (MVT) of the Lennard Shelf between Fitzroy Crossing and Halls Creek in Western Australia.
Project Geology
The Devonian-Carboniferous sea appears to have been inundating an incised coastline around a pronounced palaeo-high (Pincombe basement, Map 2 below). The oldest sediments include basal clastic rocks with a gravel beds onlapping on the basement inlier to the east. A thin succession of intertidal, and shallow marine to lagoonal facies is initially deposited within the project area while eastwards, in the Burt Range Sub-basin the basin floor subsided rapidly accumulating in excess of 2 km of marine sediments as indicated by seismic data. The articulated paleao-coast line is well illustrated W of the Norton deposit where an embayment of Devonian strata extends several kilometres SW over the basement rocks.
Prior to the onset of Carboniferous sedimentation, the marine platfroma the palaeo-topography effect appears removed. Correlation between down-hole gamma profiles shows a gradual thickening of Carboniferous strata towards the east within the project area.
The mineralisation at Sorby Hills is located in about 10- 20 m of transitional facies between the Knox Siltstone in the hanging wall and the Sorby Dolomite in the footwall and is made up of reworked clasts of Sorby Dolomite. The extensive dolomitization is inferred to be genetically related to the mineralisation and has completely recrystallized the primary calcite-rich rocks, creating porosity estimated to be up to 15% in part of the Sorby Dolomite (Ferguson 1999). A secondary dolomitization event is indicated by coarse dolomite in fracture linings and vughs.

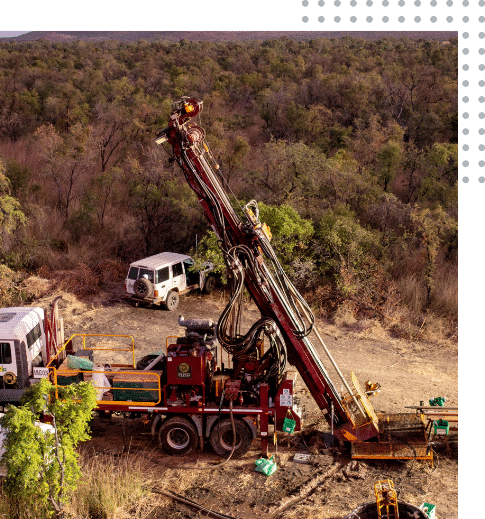
Since the commencement of exploration and resource delineation work by Boab in 2018, the Company has completed over 374 drill holes for just under 29,000m over six drilling campaigns.
In the process the Company has reached several critical milestones towards development. The aggressive work schedule has served multiple technical purposes and resulted in the release of three mineral resource statements (MRE).
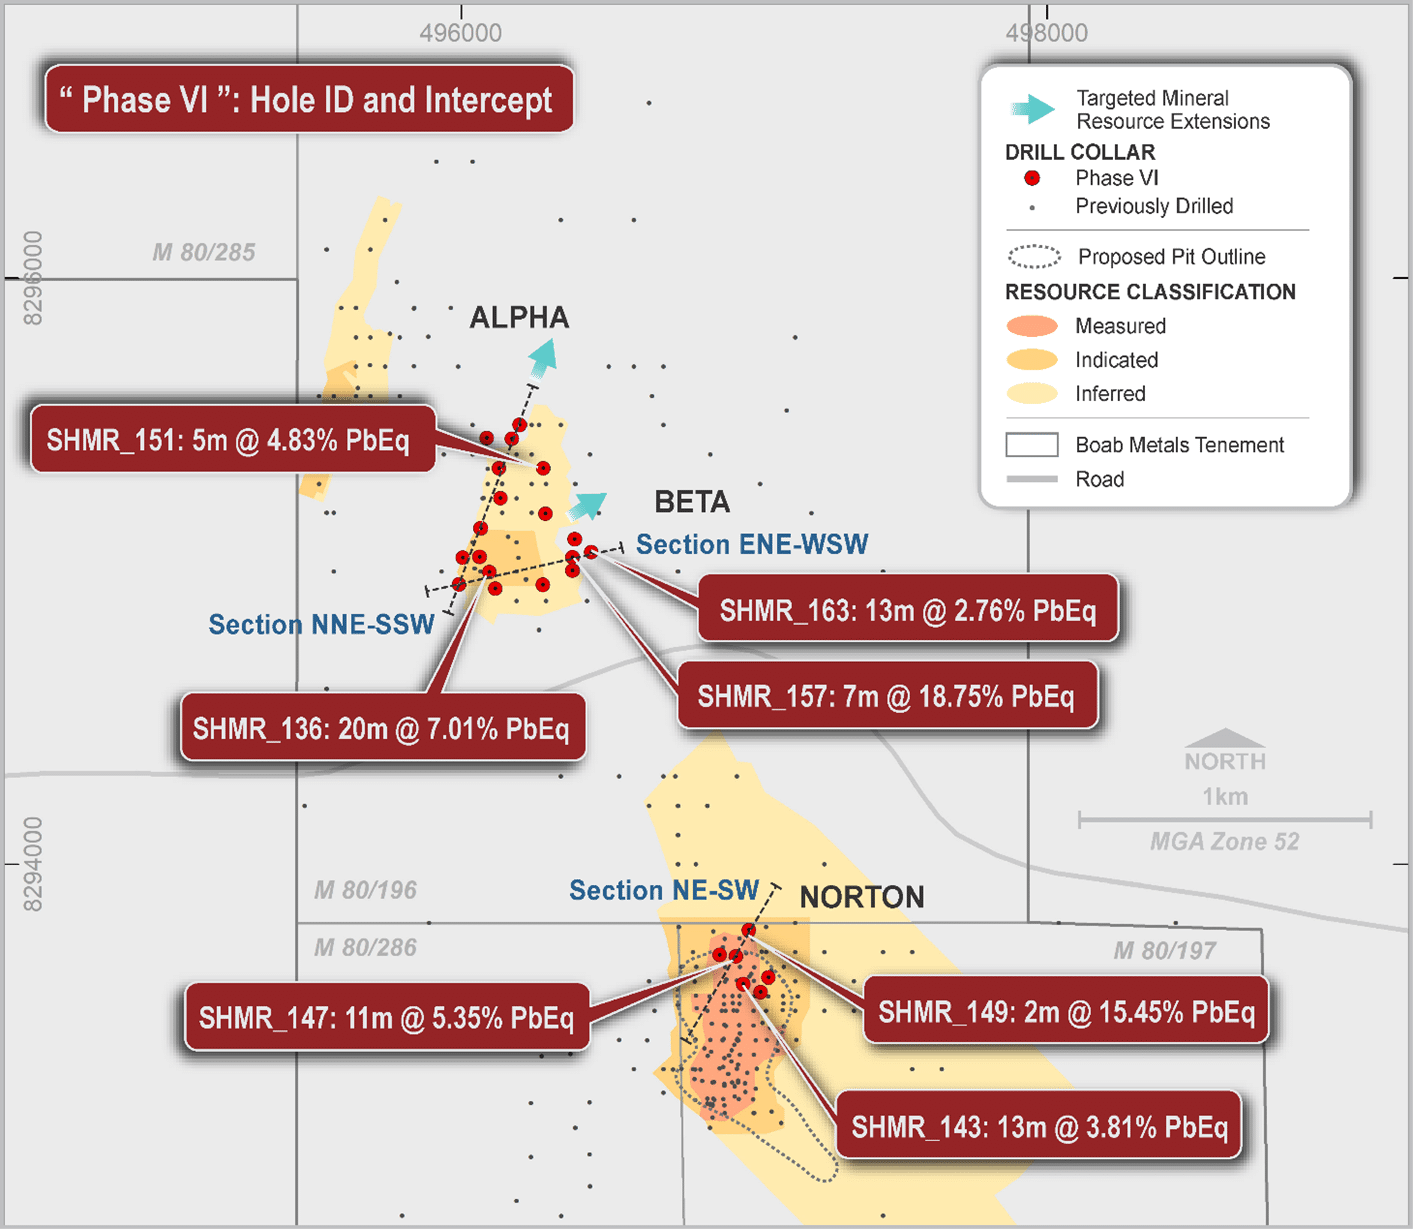
Figure 1: Phase VI drill hole plan for the Beta and Norton North area
Boab recently completed the Phase VI drilling program at the Sorby Hills Lead-Silver-Zinc Project and received positive results in key locations for Resources and Reserves growth.
The Phase VI drilling program was designed to enhance value with the later stages of the current Sorby Hills mine plan.
Positive Drilling Results from the Phase VI Program included:
- SHRC_157 (Beta): 7m @ 19.17% PbEq. (16.23% Pb & 82g/t Ag) from 72m
- Incl 3m @ 38% PbEq, (35.26% Pb & 174gt/t Ag) from 72m
- SHRC_136 (Beta): 20m @ 7.39% PbEq. (5.58% Pb & 52g/t Ag) from 65m
- Incl 8m @ 86% PbEq, (10.49% Pb & 96g/t Ag) from 77m
- SHRC_151 (Beta): 5m @ 13% PbEq. (3.70% Pb & 41g/t Ag) from 45m (New Result)
- SHRC_163 (Beta): 13m @ 2.90% PbEq. (2.26% Pb & 18g/t Ag) from 49m (New Result).
- SHRC_149 (Norton N): 2m @ 16.64% PbEq. (10.92% Pb & 163g/t Ag) from 103m (New Result) (hole terminated in mineralisation).
- SHRC_147 (Norton N): 11m @ 5.74% PbEq. (3.84% Pb & 54g/t Ag) from 86m (New Result).
- SHRC_143 (Norton N): 13m @ 4.06% PbEq. (2.82% Pb & 35gt/t Ag) from 95m
- Incl 5m @ 35% PbEq. (3.91% Pb & 41 g/t Ag) from 95m
Phase VI Overview & Objective
During the Phase VI drilling program a total of +3,020m were drilled across 28 RC holes including some that were pre-collared by mud rotary drilling and completed with RC drilling.
The primary objective of the Phase VI drilling program was to facilitate an increase in the portion of the Beta and the Norton Deposits classified as an Ore Reserve (Figure 1).
- Geological & Resource Model: a new geological and resource model have been constructed using new drilling data together with historic information
- Rock Density: Additional rock density data together with the revised geological model have led to a revised density algorithm and an appropriate density model
- Resource Classification: the improved geological interpretation and the density model have led to a re-classification of the resources and for the first time “Measured” category resources have been declared by the QP
- Resource Expansion: Since Boab has taken over the Sorby Hills Project the Company has been able to expand by 66% on its original resource estimate and the metal content (Pb) by 33%
- Metallurgy: Metallurgical recoveries after geo-metallurgical classification and additional testwork are higher with 84% silver and 94% for lead.
SORBY HILLS MINERAL RESOURCE ESTIMATE
The Mineral Resource Estimate underpinning the DFS was undertaken by CSA Global Pty Ltd in accordance with the JORC Code (2012) and announced to the ASX on 17 December, 2021.
The Mineral Resource Estimate comprises 47.3Mt at 3.1% Pb, 0.4% Zn and 35g/t Ag using a cut-off of 1% Pb. A comprehensive breakdown of the Mineral Resource by Resource classification and deposit is shown in Table 1 below. The updated estimate represents an increase in Measured and Indicated Tonnes of 2.8Mt (14%), 65kt contained Lead (9%) and 3.0Moz contained Silver (11%) versus the Mineral Resource Estimate that underpinned the Sorby Hill Pre-Feasibility Study and represents an increase of 5% Total Resources on the same basis.
Table 1: Sorby Hills Mineral Resource Estimate – Pb Domains only
| Resource Classification by Deposit |
Tonnes (Mt) |
Grade | Contained Metal | ||||
| Pb | Zn | Ag | Pb | Zn | Ag | ||
| % | % | g/t | kt | kt | koz | ||
| A | |||||||
| Inferred | 0.6 | 5.3% | 1.0% | 23 | 31 | 6 | 427 |
| Sub Total | 0.6 | 5.3% | 0.1% | 23 | 31 | 6 | 427 |
| B | |||||||
| Measured | 1.4 | 3.8% | 0.3% | 19 | 52 | 4 | 859 |
| Indicated | 1.3 | 3.4% | 0.3% | 21 | 44 | 4 | 862 |
| Sub Total | 2.7 | 3.6% | 0.3% | 20 | 97 | 8 | 1,720 |
| Omega | |||||||
| Measured | 8.5 | 3.3% | 0.4% | 37 | 279 | 32 | 9,995 |
| Indicated | 5.8 | 3.5% | 0.4% | 34 | 205 | 25 | 6,331 |
| Inferred | 2.9 | 2.7% | 0.4% | 26 | 76 | 13 | 2,414 |
| Sub Total | 17.2 | 3.3% | 0.4% | 34 | 566 | 71 | 18,948 |
| Norton | |||||||
| Measured | 2.8 | 4.1% | 0.3% | 75 | 112 | 9 | 6,668 |
| Indicated | 2.1 | 3.2% | 0.5% | 38 | 68 | 11 | 2,617 |
| Inferred | 16.2 | 2.5% | 0.5% | 27 | 402 | 75 | 14,039 |
| Sub Total | 21.1 | 2.8% | 0.4% | 34 | 590 | 96 | 24,090 |
| Alpha | |||||||
| Indicated | 0.7 | 2.6% | 0.5% | 41 | 18 | 4 | 923 |
| Inferred | 0.8 | 3.6% | 1.2% | 86 | 27 | 9 | 2,052 |
| Sub Total | 1.5 | 3.1% | 0.9% | 64 | 45 | 13 | 2,975 |
| Beta | |||||||
| Indicated | 1.0 | 4.1% | 0.2% | 42 | 42 | 2 | 1,382 |
| Inferred | 3.2 | 3.4% | 0.4% | 43 | 109 | 14 | 4,474 |
| Sub Total | 4.2 | 3.6% | 0.4% | 43 | 151 | 17 | 5,856 |
| Total Resource | |||||||
| Measured | 12.6 | 3.5% | 0.4% | 43 | 444 | 45 | 17,521 |
| Indicated | 11.0 | 3.4% | 0.4% | 34 | 377 | 46 | 12,114 |
| Inferred | 23.6 | 2.7% | 0.5% | 31 | 645 | 117 | 23,406 |
| Total | 47.3 | 3.1% | 0.4% | 35 | 1,465 | 207 | 53,042 |
Note: Tonnes and Grade are rounded. Reported at a 1.0% Pb Cut-Off. Discrepancies in calculated Contained Metal is due to rounding.
The Mineral Resource estimate is supported by RC and DD drilling samples, with holes drilled over a time span between the 1970s and 2021. At the time of the December 2021 estimate, a total of 676 drill holes had intersected the mineralisation domains, with 212 holes drilled by Boab since 2018. A total of 244 holes are historical (pre-dating 2007) but were retained based upon acceptable quality control results. Since the release of the December 2021 estimate, a further 43 RC drill holes have been completed across the Project. High-grade results from Beta (see below) and encouraging mineralisation continuity observed at Norton represent significant opportunities to further enhance the Sorby Hills Mineral Resource and Mining Production Target in the near term.
- SHRC_157 (Beta): 7m @ 16.23% Pb & 82g/t Ag from 72m
- SHRC_136 (Beta): 20m @ 5.58% Pb & 52g/t Ag from 65m; and
- SHRC_143 (Norton N): 13m @ 2.82% Pb & 35g/t Ag from 95m
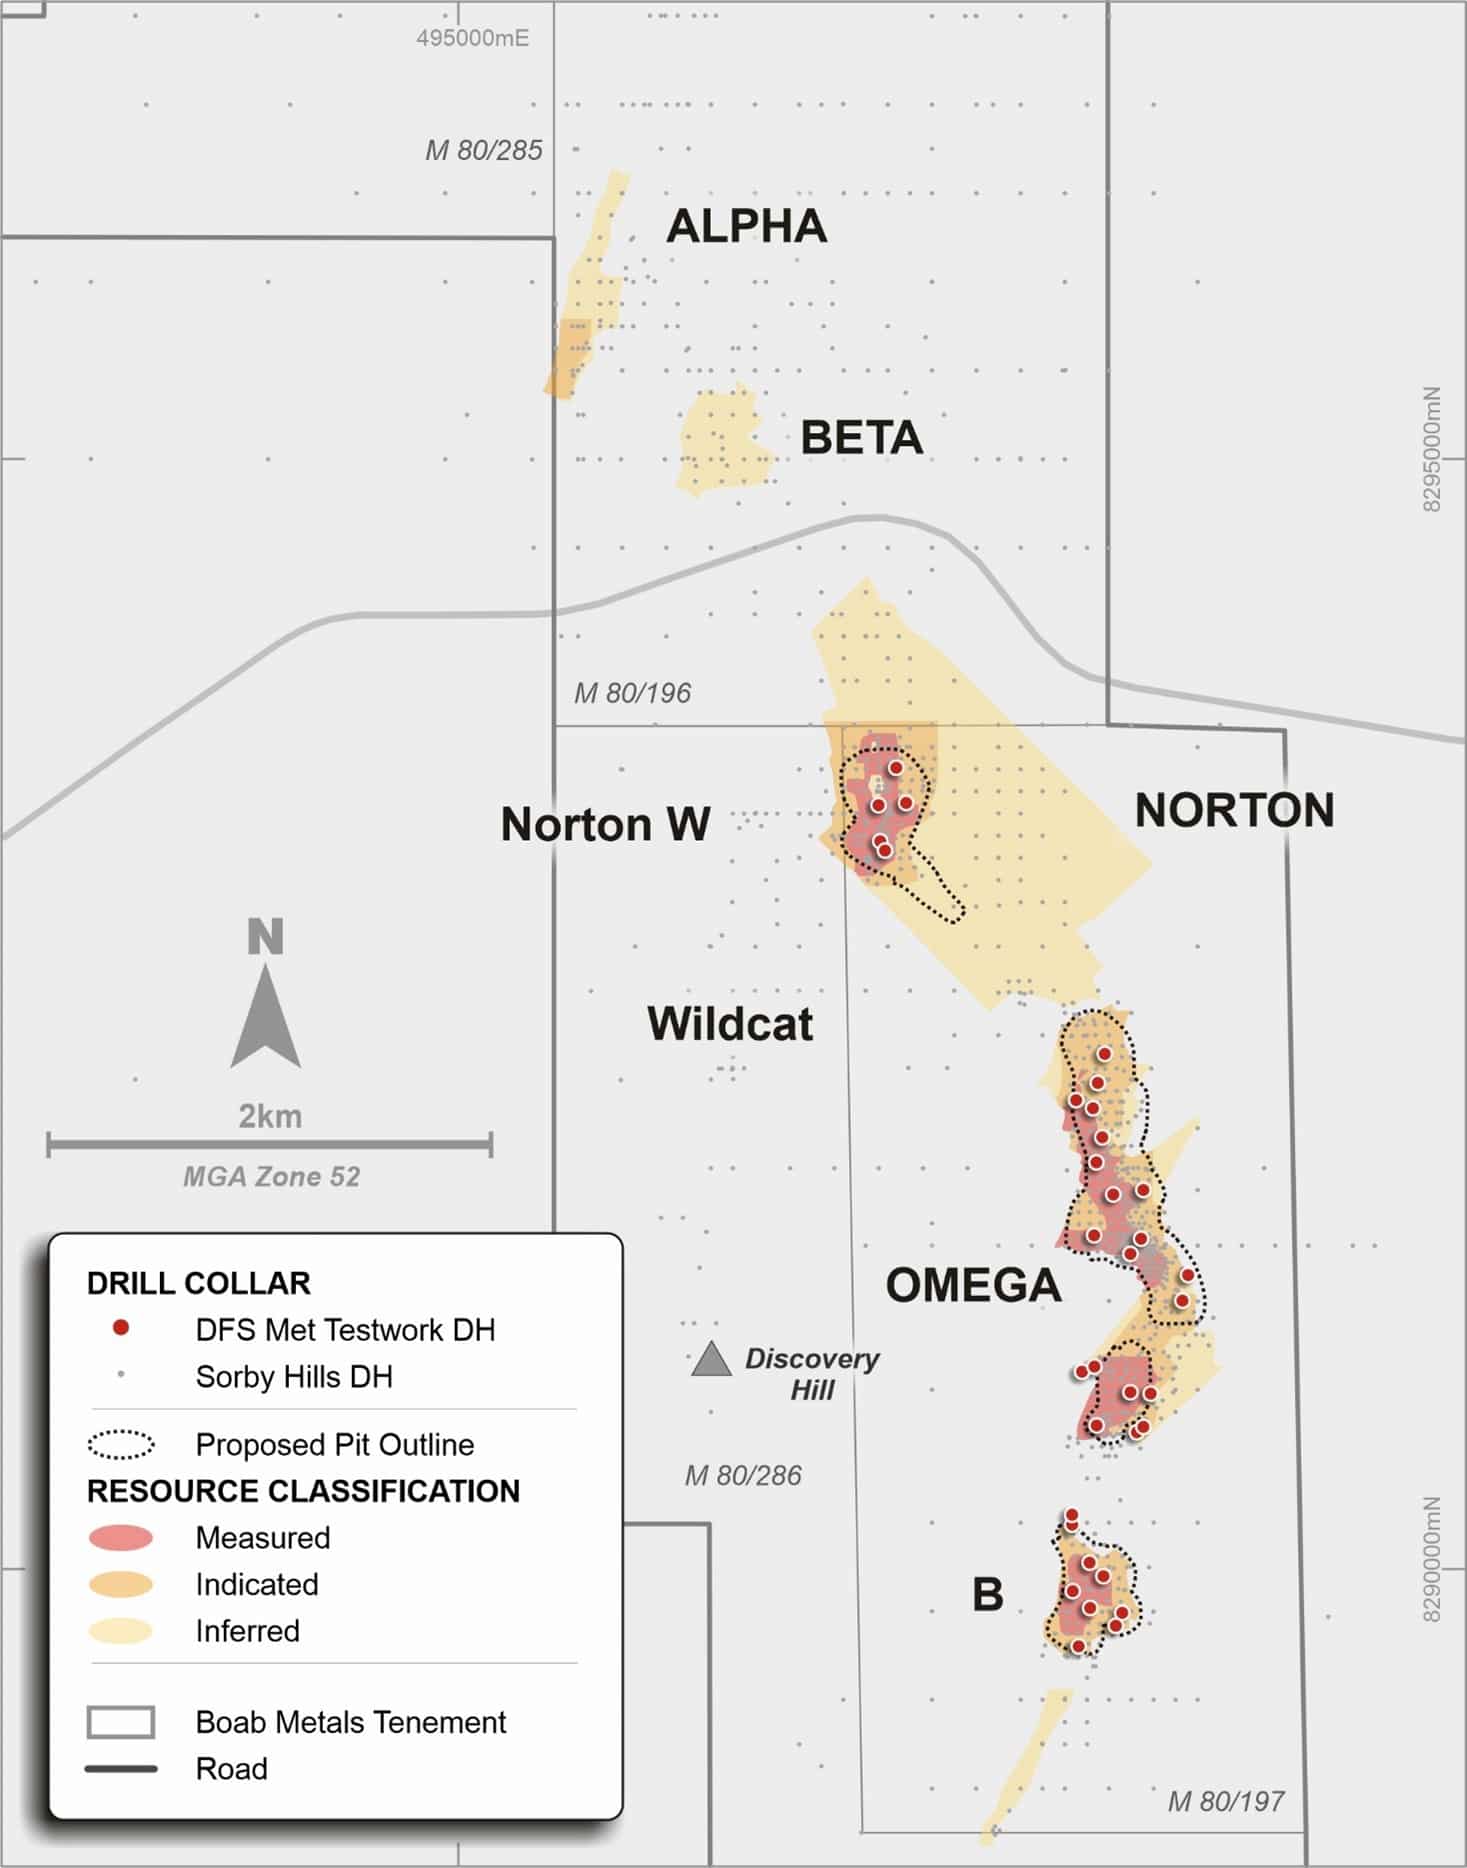
The location of drilling relative to the Mineral Resources is shown in the figure below.
Location of drill holes underpinning the DFS Mineral Resource Estimate together with more recently drilled holes to be incorporated into a future Resource update
Drillholes were sampled at 1m intervals and the drill samples were accordingly composited to 1m lengths for most deposits, with the exception of the A and Beta deposits, where samples were composited to 2m lengths. Composited sample data were statistically reviewed to determine appropriate top-cuts, with top-cuts applied for Pb, Zn and Ag where appropriate. Sample populations for Pb, Zn and Ag were split by mineralisation domains as supported by statistical analysis of assay data. The top cut and composited drill samples were used for variogram modelling. Moderate relative nugget effects were modelled for these in the primary zone.
A block model with block sizes of 10m (X) x 10m (Y) x 5m (Z) was constructed. The block sizes are approximately half the most dense drill spacing, which generally supports a Measured or Indicated classification. Blocks and drill sample data were flagged according to the geological and mineralisation envelopes. Major variogram directions were modelled in the plane of the vein towards the north-east. Grades for Pb, Zn, Ag, S and Fe were interpolated for all the grade variables by ordinary kriging. Blocks were estimated using a search ellipse of variable dimensions, ranging from 100m (major) x 30m (semi-major) x 5m (minor) dimensions for Beta, to 60m (major) x 30m (semi-major) x 5m (minor) for Omega North, with a minimum of 8 and maximum of 24 samples from a minimum of four drillholes. Search radii were increased, and the minimum number of samples reduced in subsequent sample searches if cells were not interpolated in the first two passes. Cell discretization of 5 x 5 x 1 (X, Y, Z) was employed.
Density testwork was carried out on mineralised and un-mineralised DD core samples obtained between 2018 and 2021. Core segments were measured using either the water immersion (Archimedes) technique for both wax coated and non-coated material and using the calliper method. There was a very strong correlation between the two methods. A total of 978 measurements were taken using the water immersion technique and these results were used to derive a base density value, and applied to an algorithm based upon interpolated Pb, Zn and Fe grades.
The following formula was derived and used to calculate the bulk density for each block in the block model, where Pb, Zn and Fe are the estimated block grades, and BD is the base density value assigned to a combination of each of the lithostratigraphic and weathering domains.
Density = 100/((100-Pb%-Zn%-Fe%)/ BD) + Pb/11.35 + Zn/7.14 + Fe/7.87)
The host rock sequences exhibit a natural porosity related to mineralisation, which is not uniform in its distribution and sometimes not always recognisable during visual inspection of the DD core. The spatial distribution of the density data throughout the deposit do not fully capture the distribution of the porosity and therefore a cautionary tonnage adjustment factor was applied during the final grade-tonnage reporting stage. The final tonnage estimates were reduced by 1% globally to account for the visually estimated porosity levels.
The Mineral Resource was classified based upon drillhole spacing, quality of sampling and sample analyses, quantity of density measurements, the relative confidence in the geological interpretation, and the ‘slope of regression’ (SOR) outputs from the kriging grade interpolation. A drill spacing equal to or less than 25m (north) by 25m (east) was used to initially define the Measured volumes and a drill spacing equal to or less than 50m (north) by 50m (east) was used to initially define the Indicated volumes. The block model was viewed in plan section, with blocks coloured by SOR (typically > 0.7) to assist this process. Inferred volumes are based upon a drill spacing of 50 to 100m (northing) by 50 to 100m (easting).
UPDATED ORE RESERVE STATEMENT
Boab announced an updated Ore Reserve for the Sorby Hills Project, as shown in the table below. The Ore Reserve was prepared by independent mining consultants Entech Pty Ltd in accordance with the JORC Code 2012. The 15.2Mt Ore Reserve is a subset of the 18.3Mt DFS Mining Inventory and represents a 12% increase over the previous 13.6Mt Ore Reserve estimate for the Project. For futher information (see ASX announcement Sorby Hills Definitive Feasibilty Study, dated 19 January 2023).
Updated Ore Reserve Estimate
| Ore Reserve Category |
Ore (Mt) |
Grade | Contained Metal | ||
| Pb (%) | Ag (g/t) | Pb (kt) | Ag (Moz) | ||
| B Pit | 1.32 | 3.4% | 18 | 45 | 0.7 |
| Norton | 1.87 | 4.0% | 80 | 74 | 4.8 |
| Omega Main | 4.98 | 3.6% | 42 | 179 | 6.7 |
| Omega South | 2.18 | 2.8% | 27 | 61 | 1.9 |
| Beta | – | – | – | – | – |
| B Pit | 0.94 | 3.0% | 17 | 28 | 0.5 |
| Norton | 0.04 | 4.0% | 40 | 2 | 0.1 |
| Omega Main | 2.30 | 3.8% | 34 | 86 | 2.5 |
| Omega South | 0.62 | 3.2% | 37 | 19 | 0.7 |
| Beta | 0.99 | 3.7% | 38 | 37 | 1.2 |
| Probable | 4.90 | 3.5% | 32 | 172 | 5.0 |
| Total Ore Reserve | 15.20 | 3.5% | 39 | 531 | 19.1 |
Note: Tonnes and Grade are rounded. Reported at a 1.0% Pb cut-off. The above data has been rounded to the nearest 10,000 tonnes ore, 0.1% lead grade and 1,000 lead tonnes, 1g/t silver grade and 100,000 silver ounces. Discrepancies in calculated Contained Metal is due to rounding. Ore Reserves have been calculated using metal prices of A$3,313.91/t Pb and A$37.89/oz Ag and royalties of 4.3% of gross revenue including allowable deductions.
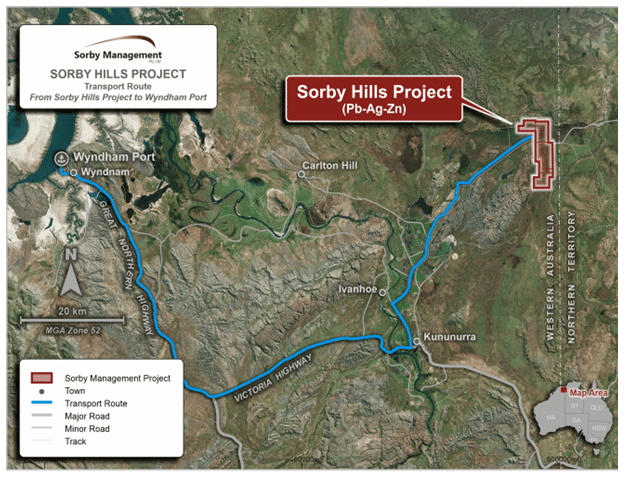
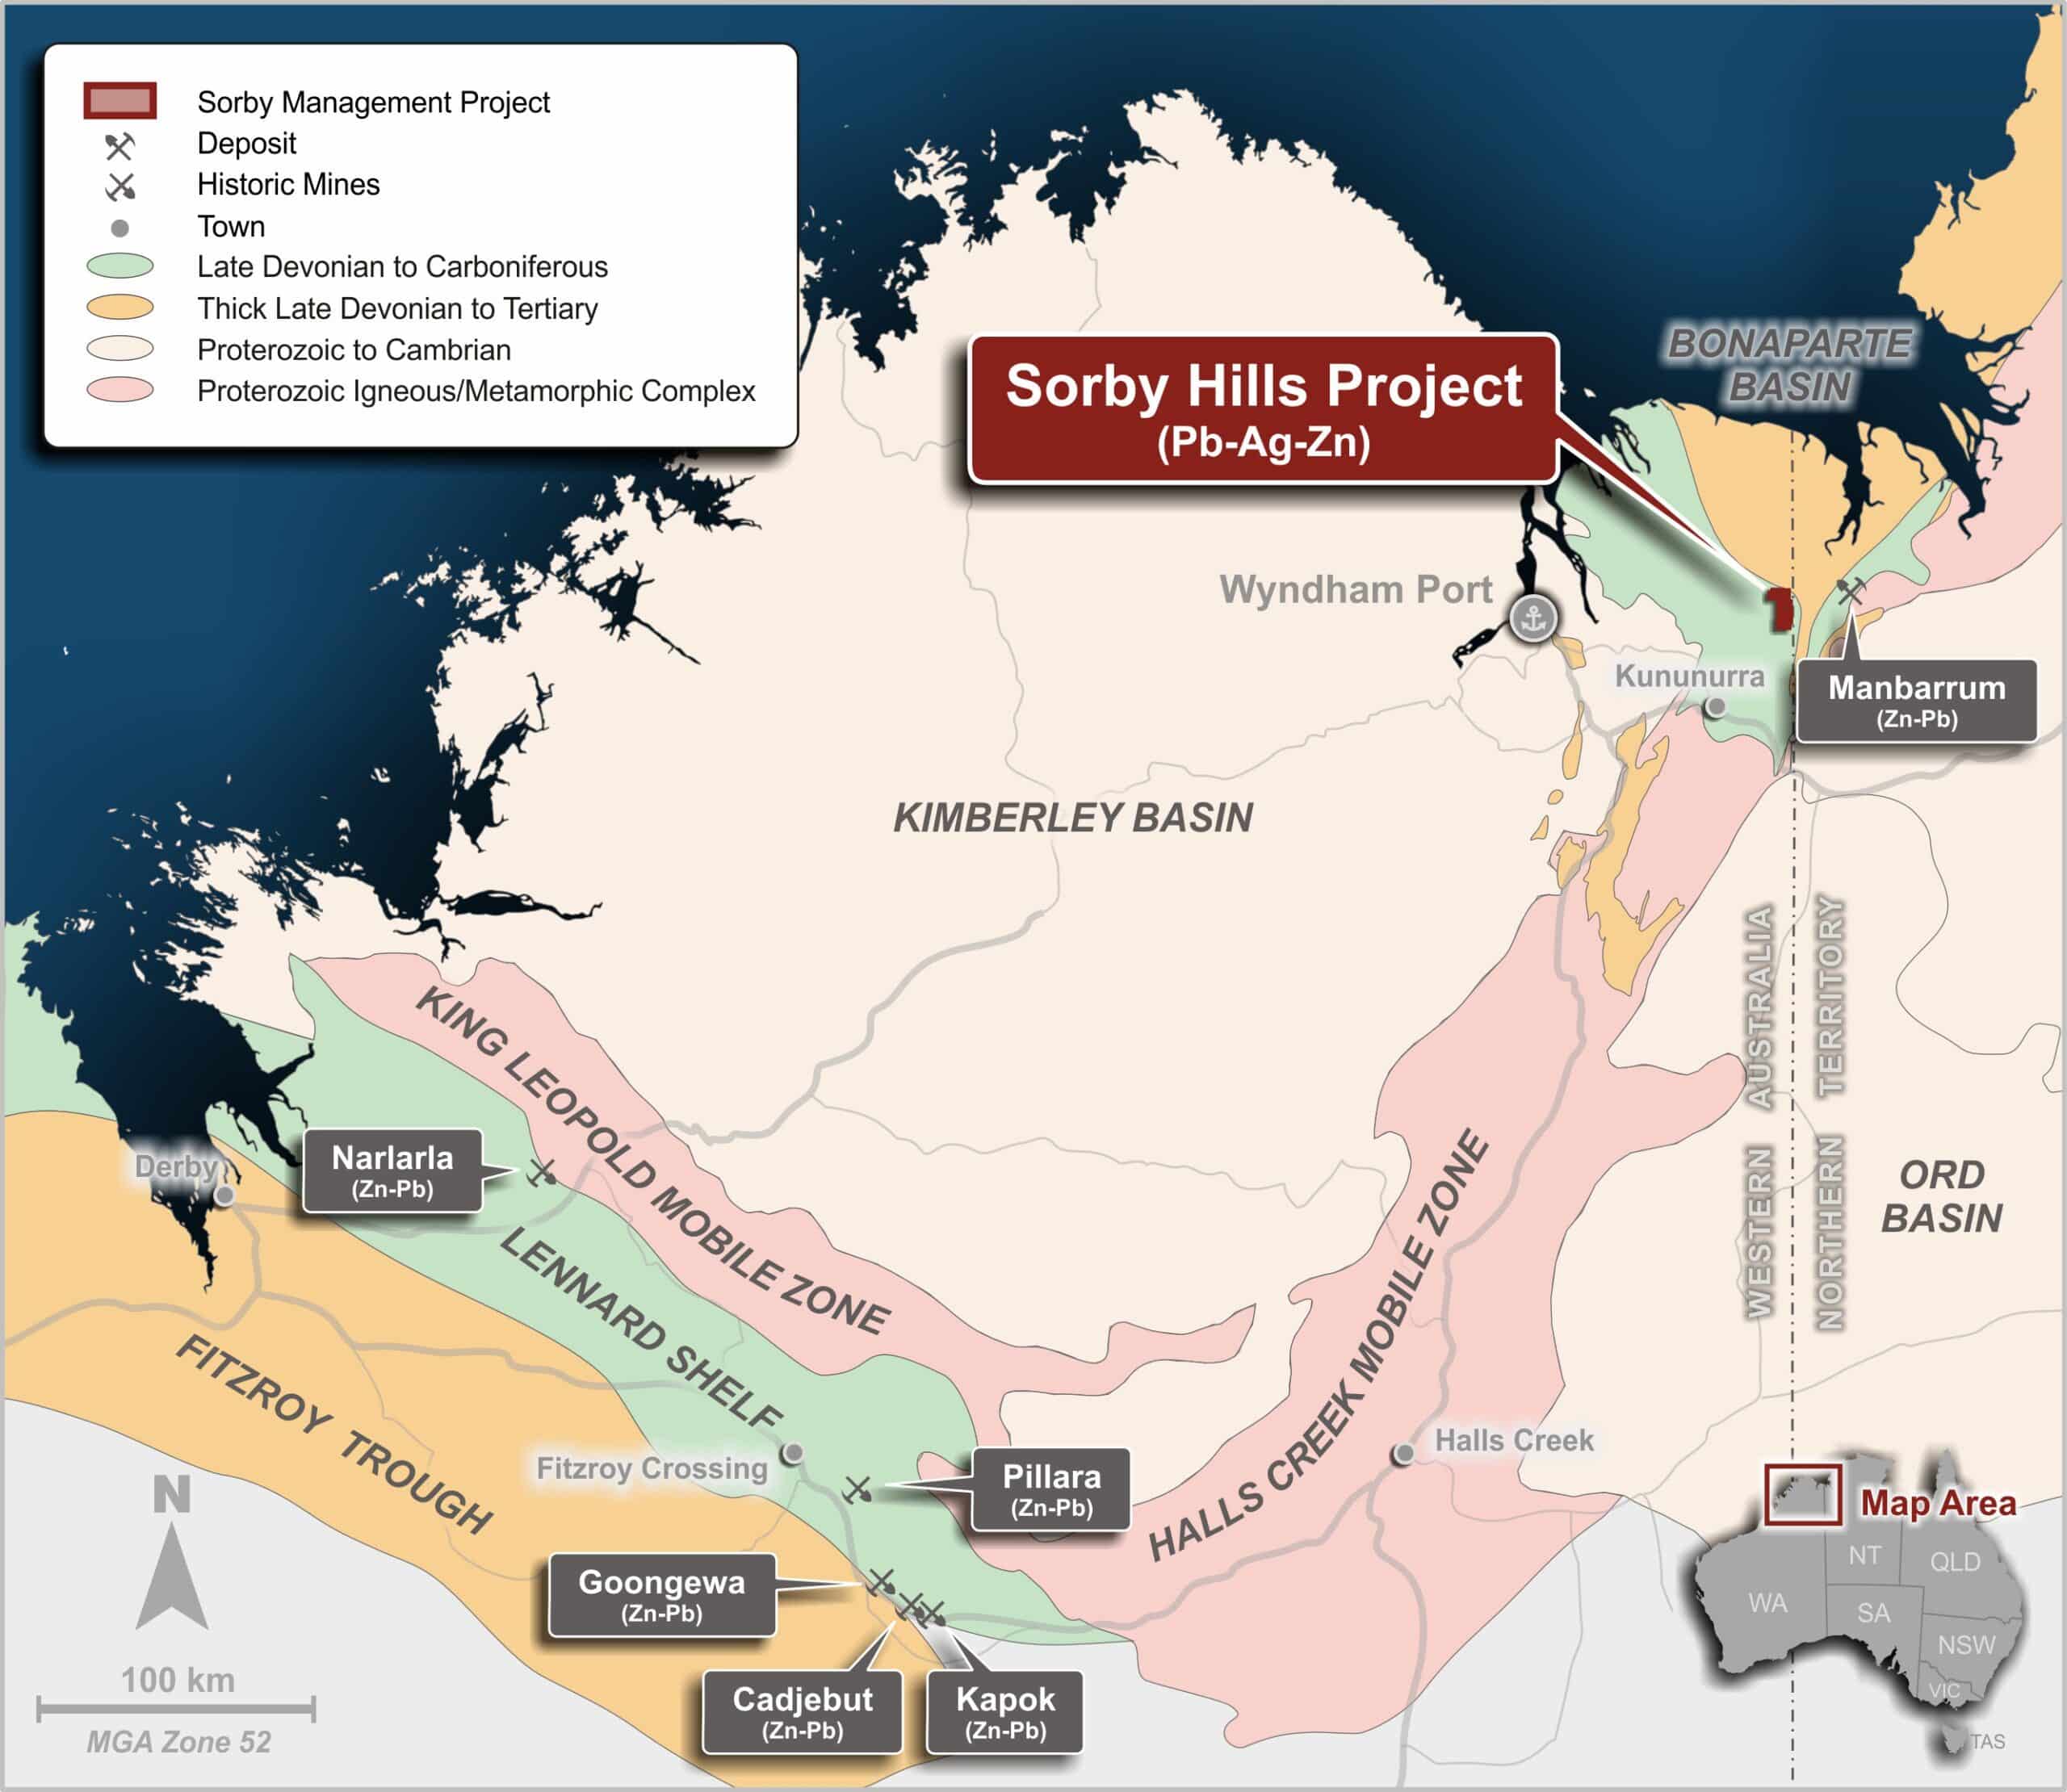
Figure 1: Location of the Sorby Hills Project
Highlights of the DFS included:
- A$705M net cash flow, NPV8 of A$370M, IRR of 35% and an average annualised EBITDA of A$119M.
- Pre-production Capital Cost of A$245M.
- C1 cash cost of US$0.39/lb payable Pb (including a net Silver credit of US$0.38/lb payable Pb) delivering an average operating margin of 41%.
- High-confidence study with up-to-date tendered pricing for 75% of Capital Costs.
- An updated Mineral Resource Estimate by CSA Global achieving a 78% increase in Measured Resources.
- Production Target underpinned 83% by Ore Reserves, including a 12% increase in overall Reserves and a 53% increase in Proved Ore Reserves.
- Significant pre-production upside potential.
The Sorby Hills DFS was completed against a dynamic economic backdrop and achieved a result that largely withstood the impact of global inflationary pressure. Approximately 75% of the pre-production capital expenditure and direct mining costs were underpinned by current tendered pricing, thus minimising the risk of substantial cost increases as has been evident in other mining projects.
Over the initial 8.5-year processing period contemplated by the DFS, 18.3Mt of ore will be mined and processed through a simple crush-mill-flotation circuit at an initial rate of 1.5Mtpa expanding to 2.25Mtpa after 1 year of production. Concentrate will be produced at an average 103ktpa, containing 64ktpa of payable Lead and 2Moz p.a. of payable Silver, and transported ~150km by road in sealed half-height containers to Wyndham Port from where it will be shipped to market (Figure 1).
The Project generates A$705M of pre-tax free cash flow over the Life of Mine and an average annualised EBITDA of A$119M per annum during operations (Table 1). Pre-production capital expenditure is estimated at A$245M and net C1 Cash Costs have been calculated to be US$0.39/lb payable Lead (Table 2). The Project generates a pre-tax NPV8 of A$370M and an IRR of 35% (from the start of construction) and a payback period of 2.5 years (from the start of operations).
Boab is of the view that the DFS represents just the starting point for the future of its Lead-Silver operations in the East Kimberley region. The Company has a number of opportunities to increase mine life through a combination of exploration and Resource extension drilling programs which are either already in progress or planned for when mine development occurs across the Project.
Key opportunities include:
- Sorby Hills Mineral Resource and Production Target Development – Potential to improve Mineral Resource Estimate and production target as a result of the final Phase V drilling results and the Phase VI drilling that have not yet been incorporated into the Resource model.
- Norton Deposit Metallurgy – Potential to improve metal recoveries at Norton with additional testwork across the deposit.
- Backup Power Review – Potential to reduce the size of the backup diesel power station to further reduce the cost of power supply. Discussions have commenced with Horizon Powe
- Improved Mining Costs – Investigate opportunities that have come to light late in the process of the DFS to improve the mining costs by adopting a bespoke pricing methodology.
- Further Review of Tendered Pricing – Contracts formally tendered during the DFS were done so at a time considered to be at the height of the inflation curve in the West Australian mining and construction industry. The Company considers there to be a lot of upsides to be gained on the prices already received through workshops and strategy sessions with key proponents.
- Road Haulage – The base case for haulage of concentrate in the DFS is non-concessional loading. Investigations are underway to determine if approval for concessional loading can be obtained, meaning an increased payload in each container.
Table 1: Sorby Hills DFS – Life of Mine Metrics
| Item | Unit | Value |
| Physicals | ||
| Life of Mine | Years | 8.5 |
| ROM Mined | ‘000 t | 18,263 |
| Strip Ratio | Waste:Ore (t:t) | 7.5 |
| Processed Tonnes | ‘000 t | 18,263 |
| Lead Grade | % | 3.4 |
| Silver Grade | g/t | 39 |
| Lead Recovery | % | 91% |
| Silver Recovery | % | 82% |
| Concentrate Produced | ‘000 dmt | 872 |
| Avg Lead Grade | % | 65.5 |
| Avg. Silver Grade | g/t | 665 |
| Payable Lead | ‘000 t | 543 |
| Payable Sliver | ‘000 oz | 17,232 |
| Cash Flow | ||
| Lead Revenue | A$M | 1,790 |
| Silver Revenue | A$M | 692 |
| Gross Revenue | A$M | 2,481 |
| Lead Treatment Charge | A$M | (159) |
| Silver Refining Charge | A$M | (32) |
| Royalties | A$M | (94) |
| Net Revenue | A$M | 2,196 |
| Logistics | A$M | (121) |
| Mining | A$M | (591) |
| Processing | A$M | (391) |
| G & A | A$M | (88) |
| Net Operating Cash Flow | A$M | 1,005 |
| Pre-Production Capital | A$M | (245) |
| Sustaining Capital & Closure | A$M | (55) |
| Net Project Cash Flow | A$M | 705 |
| Value Metrics | ||
| Pre-Tax NPV8 | A$M | 370 |
| Pre-Tax IRR | % | 35% |
| Average Annual EBITDA | A$M | 119 |
Macroeconomic assumptions for Lead, Silver and FX were based on the forward curves extracted from Bloomberg on 16 January 2023.
Table 2: Operating Cost Summary
| Item | Total (A$M) | A$/t ore | US$/lb payable Lead |
| Mining | 591 | 32.4 | 0.34 |
| Processing | 391 | 21.4 | 0.22 |
| G&A | 88 | 4.8 | 0.05 |
| Logistics | 121 | 6.6 | 0.07 |
| Lead Treatment | 159 | 8.7 | 0.09 |
| C1 Costs (ex Credits) | 1,351 | 73.9 | 0.77 |
| Net Silver Credits | (660) | (36.1) | (0.38) |
| C1 Costs | 690 | 37.8 | 0.39 |
| Royalties | 94 | 5.2 | 0.05 |
| Sustaining Capital | 55 | 3.0 | 0.03 |
| AISC | 840 | 46.0 | 0.48 |
The primary objective of the DFS Metallurgical Testwork Program was to deliver robust results to underpin the Sorby Hills DFS Process Plant design criteria.
The program comprised a total of 35 HQ diamond drill holes included in the Phase IV and V drilling. From these holes, approximately 1,420kg from 399m of half core was collected, combined and composited into Variability Samples, Schedule Composites and Master Composites. Samples and Composites were utilised for a range of testwork including Flotation, Comminution, Mineralogy, Heavy Liquid Separation, Tailings Thickening, Concentrate Filtration and Concentrate Analysis.
The DFS Metallurgical Testwork Program builds upon a significant body of previous metallurgical testwork undertaken by SMPL since acquiring Sorby Hills in 2018 and others dating back to 1979.
Master Oxide, Fresh and Blended composites were produced for initial flotation optimisation. A total of 34 samples exhibiting a range of head grades, mineralogical compositions and source locations were prepared as Variability Samples. Scheduled-based composites were made to represent the PFS mine schedule for years 1-2, 3-4 and 5+, for each of the Oxidised, Fresh and Fresh-Oxidised Blend ore types. Lower-grade sample material was selected for HLS testing (See Table 1 below).
Table 1: DFS Metallurgical Testwork Program – Sample Summary
| Test Type | Variability Tests | Composites Tests |
| Flotation | 34 |
3 x Schedule and 3 Master for each of Fresh, Oxidised and Blend |
| Comminution | 18 | 3 x Schedule |
| HLS | 13 | 2 |
Metal recoveries adopted for economic modelling for the Sorby Hills Pre-Feasibility Study were Lead: 94.9% (Fresh Ore) and 84% (Oxidised Ore) and Silver: 78.2% (Fresh Ore) and 94.4% (Oxidised Ore).
Table 2 below presents a summary of the final Sorby Hill DFS Flotation performance estimates. Recovery estimates are based on the Schedule Composite test results, and for the specific deposit estimates, the average Variability Sample test performance for that deposit. These results incorporate modifications based on Locked-Cycle testwork to account for closed circuit performance estimation and, in the case of separate Oxidised and Fresh Ore-only recoveries, adjustments to account for operational inefficiencies associated with campaign-style processing.
Whilst the extensive variability testwork has identified the recovery achieved at Norton was less than that at other deposits, superior results in selected Norton Variability Samples suggests the poorer results are spatially constrained and that the higher performing ore within Norton can be prioritised.
A comprehensive assay was undertaken on Lead-Silver Concentrate produced from each locked cycle test. The results of these assays have been provided to potential offtakers.
Table 2: Sorby Hills DFS Final Flotation Performance Estimates
| Ore Type |
Feed % Pb |
Feed g/t Ag |
Conc Grade | Conc Recovery | ||
| %Pb | g/t Ag | %Pb | % Ag | |||
| Oxide Batch Treatment | ||||||
| Schedule Y1-2 | 5.14 | 42 | 62.3 | 520 | 89.9 | 92.4 |
| Schedule Y3-4 | 4.03 | 44 | 60.3 | 686 | 85.5 | 88.3 |
| Schedule Y5+ | 5.15 | 86 | 67.3 | 1262 | 79.9 | 89.3 |
| Norton | 8.93 | 168 | 66.0 | 1305 | 85.6 | 89.9 |
| Beta | 3.20 | 35 | 50.0 | 509 | 60.1 | 56.5 |
| Fresh Batch Treatment | ||||||
| Schedule Y1-2 | 4.53 | 61 | 66.9 | 816 | 95.1 | 86.3 |
| Schedule Y3-4 Ex Norton | 3.27 | 19 | 64.3 | 330 | 95.1 | 84.8 |
| Schedule Y5+ | 4.04 | 32 | 68.5 | 479 | 95.1 | 83.9 |
| B Pit | 2.89 | 16 | 65.7 | 326 | 95.1 | 83.9 |
| Omega, Omega South | 4.31 | 43 | 66.2 | 599 | 95.2 | 87.0 |
| Norton | 4.24 | 72 | 56.9 | 966 | 78.1 | 77.9 |
| Beta | 2.10 | 22 | 72.3 | 577 | 90.3 | 70.3 |
The DFS Metallurgical Testwork Program further explored Dense Media Separation (DMS). The DFS results for the DMS demonstrated a reduced recovery and highlighted additional process design and operation risk. Therefore, the DMS option is not recommended and was not considered further for DFS.
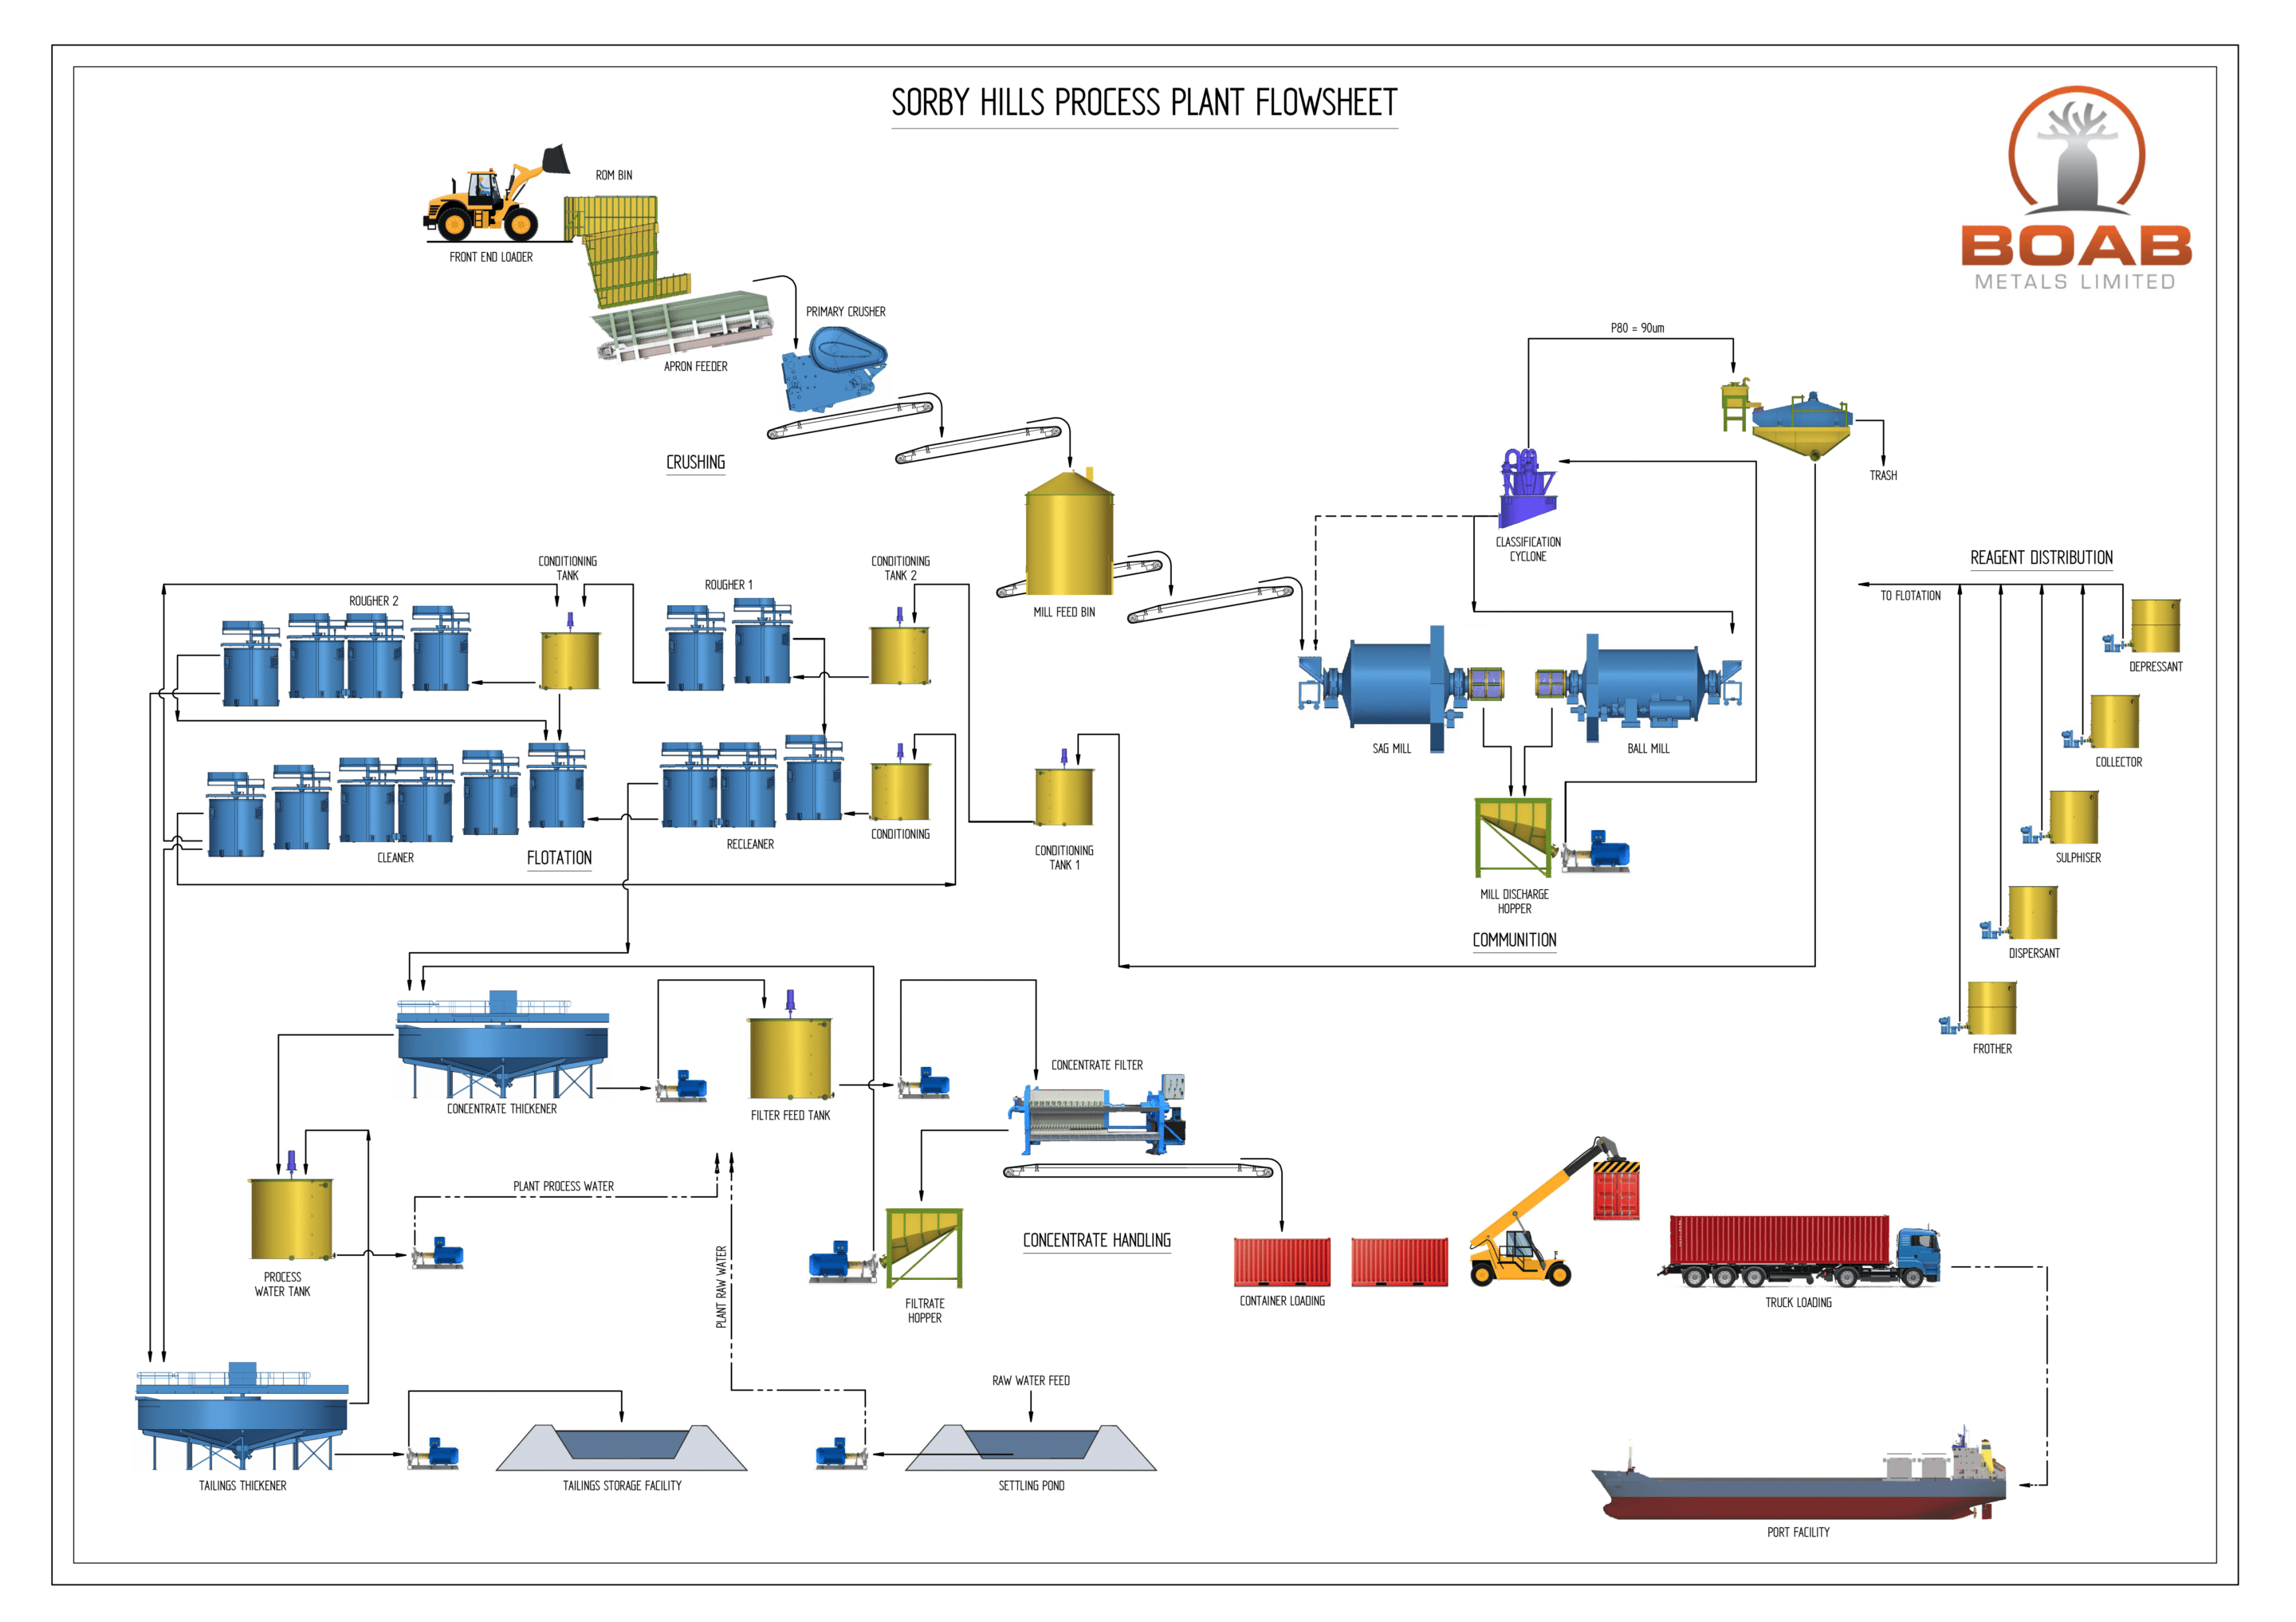
Flowsheet and Plant Design
The Sorby Hills process plant is designed to treat 2.25Mtpa of ore. In the initial year of operation while head grade is at its highest the process plant throughput rate is at a nominal 1.5Mtpa. This processing rate profile maintains concentrate production as the grade reduces after the first year. Comminution and flotation circuit equipment sizing has been based on providing the required “turn-down” ability to operate at the lower initial throughput capacity. A high-level process diagram is presented below. The design of the processing facilities has been undertaken in accordance with the following philosophy:
- A simple and robust flowsheet using well established methods;
- Well proven equipment;
- Ease of maintainability;
- Best practice OHS&E protection;
- Ten-year life operating continuously 24 hours per day, 365 days per year; and
- An overall plant availability of 91.3% or 8000h/yr.
The crushing plant consists of a single stage jaw crusher with a fully enclosed crushed ore surge bin ahead of the grinding circuit. The grinding circuit consists of a SAG-ball circuit operating in closed circuit with hydrocyclone classification. SAG mill discharge trommel oversize is recirculated to the SAG mill feed via conveyor without pebble crushing. Cyclone overflow passes through a trash screen before entering the flotation circuit.
The flotation circuit consists of two stages of roughing, 1st cleaner, cleaner-scavenger and recleaner banks. Fast floating material from rougher 1 is directed to the recleaner feed. Rougher 2 concentrate feeds cleaner 1, while cleaner 1 concentrate also feeds the recleaner. Cleaner scavenger concentrate recycles to rougher 2 feed, while the cleaner scavenger tailings report to final tailings. Recleaner tails returns to 1st cleaner feed. Two conditioning tanks are provided for initial rougher reagent addition. An additional conditioner is provided for rougher 2 for additional sulphurdisation. A 1st cleaner conditioning tank is also provided. The first rougher conditioning tank also has flow rate stabilisation functionality.
Concentrate is thickened and stored in a filter feed tank before being dewatered in a vertical plate and frame filter press with direct transfer of concentrate into half height shipping containers for transport. Tailings are thickened and sent to the TSF initially and in pit disposal in later years.
Plant services include reagents, water, air, office, workshop, stores and laboratory facilities. The plant is automated with a Programmable Logic Controller (PLC) / Supervisory Control and Data Acquisition (SCADA) type configuration. An on-stream-analysis system is provided for major metals (Pb, Ag, Fe, Zn) in six flotation streams and feed galena / cerussite mineralogy on the feed stream.